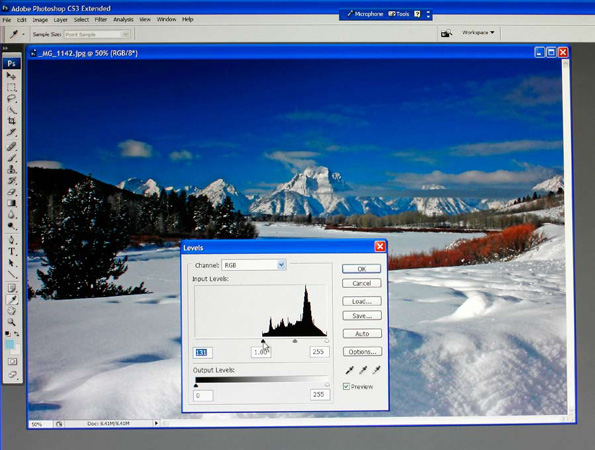
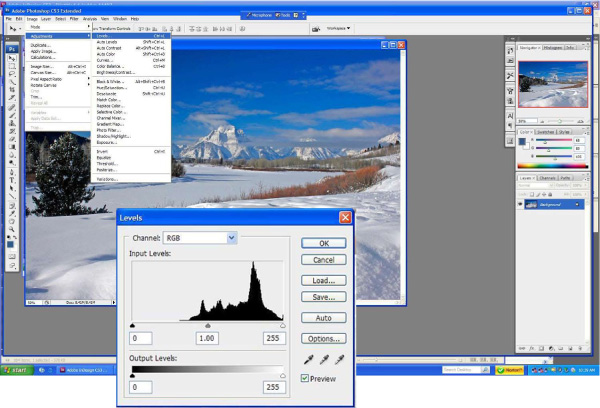
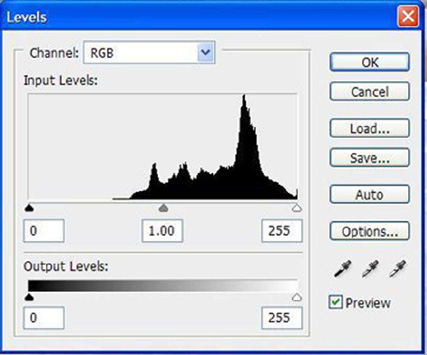
Levels
This is my favorite command to adjust the contrast, brightness, tonal range, and auto color to my final image. Levels are the easiest to master control and its results are effective. It was designed to process images for a perfect printout and web page use. It measures the RGB (red, green, blue) pixel colors in a 0 to 255 scale.
A graph or histogram pops up that is similar to a bell curve. This graph’s shape and slant give you immediate information concerning the image’s darkness, lightness, low contrast and high contrast.
The base of this histogram is calibrated in the input of 0 to 255 ranges. Three sliders are located at this base. These are easily adjusted.
The black triangular slider is on the far left and it is used to set the shadow point.
The gray triangular slider is in the middle and it is used to set the mid tones. This corrects exposure or scanner mistakes.
The white triangular slider is on the far right and is used to adjust the white or highlights.
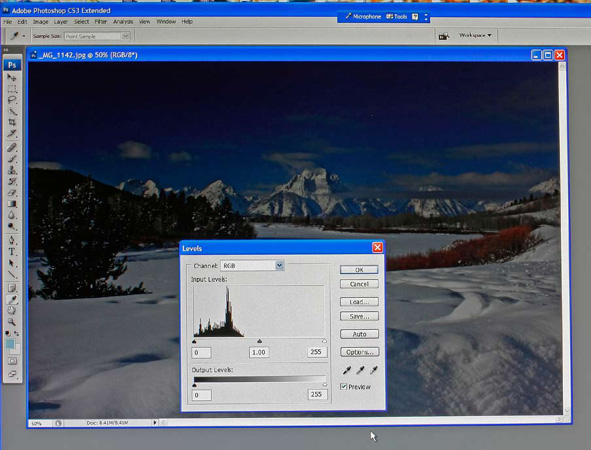
A light image’s histogram leans towards the right side of the scale (above). This shows that there is an abundance of white and light shades in the image. To correct, slide the mid tone slider to the right (below).
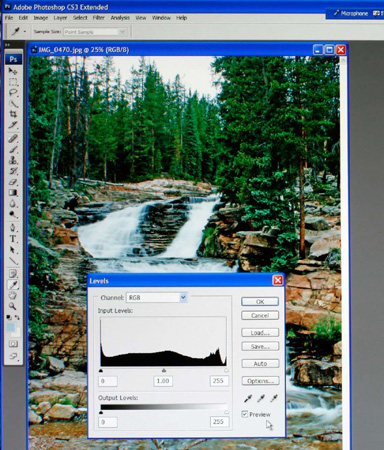
A dark image’s histogram leans towards the left side of the scale (above). This indicates that there are far more shades of blacks and dark grays in the image. To simply correct this problem, slide the mid tone slider to the left (below).
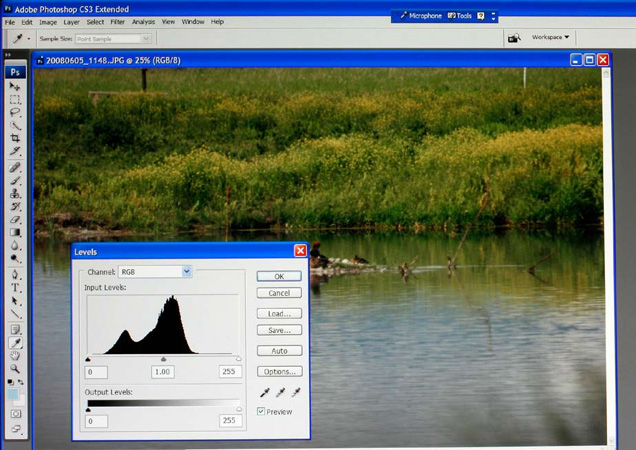
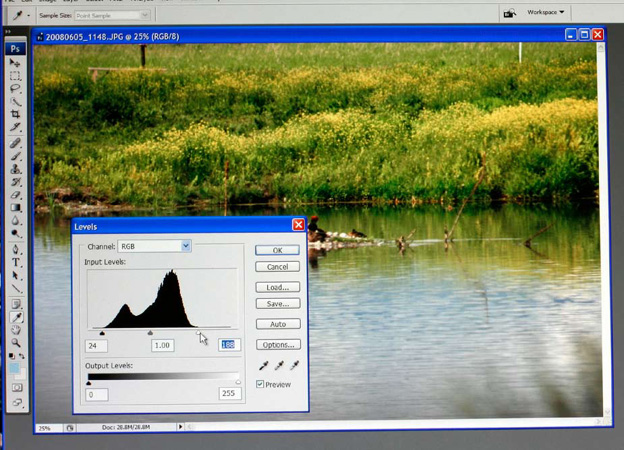
A low contrast image lacks both strong blacks and whites and puts the bulk of the histogram in the center of its baseline (above). This indicates a flat and dull image. To correct the problem, move the black and white sliders inward until they touch the ends of the histogram (below).
The histogram of a high contrast image peaks in both the far left (black) side and in the far right (white side) of the graph.
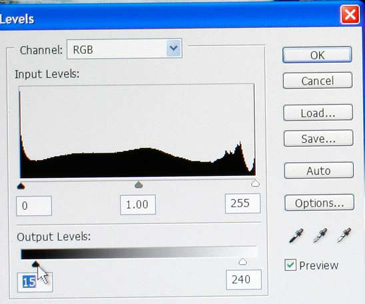
A high contrast image has too many black and white areas. To correct this you use the output sliders found below the input sliders. Simply drag both of these sliders slightly toward the center. This changes black to dark gray and white highlights to light gray.
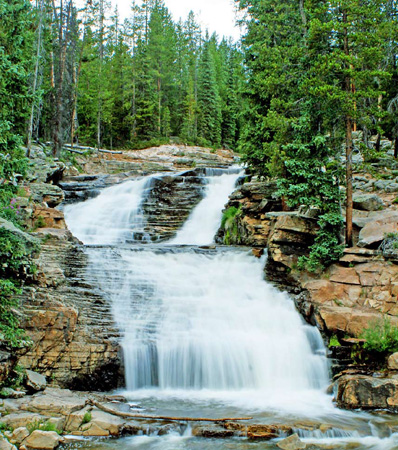
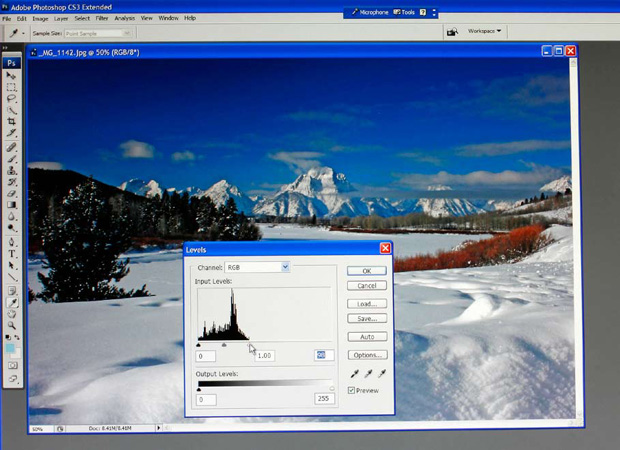
Corrected Image